





Ross Stores’ stock has risen approximately 10-12% year-over-year since November 2024 (closing ~$159.90 as of November 18, 2025). The sharp sell-off following the April 2025 tariff announcements (“Liberation Day”) created a meaningful dip, but the subsequent recovery has pushed shares near recent highs. With Q3 earnings scheduled for today (November 20, 2025), investors face a key question: take profits now or wait for potential further upside?
Ross Stores Overview
Ross Stores, Inc. (NASDAQ: ROST) is a leading off-price retailer of apparel and home fashion in the consumer discretionary sector. It operates primarily under the Ross Dress for Less banner, offering discounted branded clothing, footwear, and home goods. As of late 2025, Ross runs over 2,200 locations (including ~360 discount stores) across 44 states, Washington D.C., Guam, and Puerto Rico.
Fundamental Landscape
The apparel retail sector is expected to face headwinds in 2025-2026 due to elevated tariffs on Chinese imports. However, off-price retailers like Ross often benefit during trade disruptions and economic uncertainty, as budget-conscious consumers “trade down” to bargains while Ross gains from increased closeout merchandise availability from vendors.
Recent Earnings Performance
- Q2 FY2025 (reported August 22, 2025): EPS of $1.56 (beat consensus ~$1.53-1.54). Revenue ~$5.53B (slight miss).
- Q3 FY2025 consensus (today): EPS ~$1.41 (range $1.38-1.42), with analysts expecting another potential beat given Ross’s strong track record of earnings surprises and resilient comparable sales.
- Wall Street remains bullish: Moderate Buy consensus from 17 analysts, targeting ~$170–172 (12-month price target ) (updated November 2025; two fresh upgrades after strong Oct/Nov comps).
| Ticker | Company | Current Price | Forward P/E | EV/EBITDA | Analyst Consensus Target | Implied Upside (Analysts) | Morraevo REWA Target (Primary) | Morraevo Potential Move |
|---|---|---|---|---|---|---|---|---|
| ROST | Ross Stores Inc. | $160.45 | 24.8× | 15.2× | $170–$172 (high $188) |
+6% to +17% | $132–$142 (core ~$138 by Q2 2026) |
−13% to −18% |
| TJX | TJX Companies | $151.20 | 26.5× | 17.8× | $152–$155 (high $172) |
+1% to +14% | N/A | N/A |
| BURL | Burlington Stores | $272.50 | 28.1× | 18.4× | $340–$350 | +25% to +29% | N/A | N/A |
| OLLI | Ollie’s Bargain Outlet | $128.10 | 29.4× | 19.1× | $140–$145 | +9% to +13% | N/A | N/A |
Ross Stores Technical Outlook (the Refined Elliott Wave Perspective)
Elliott Wave Theory identifies recurring price patterns driven by crowd psychology, alternating between five-wave impulse moves and three-wave (A-B-C) corrections.
Elliott Wave Color Code & Labeling (quick guide)
🟢 Technical Analysis Map: Elliott Wave Legend
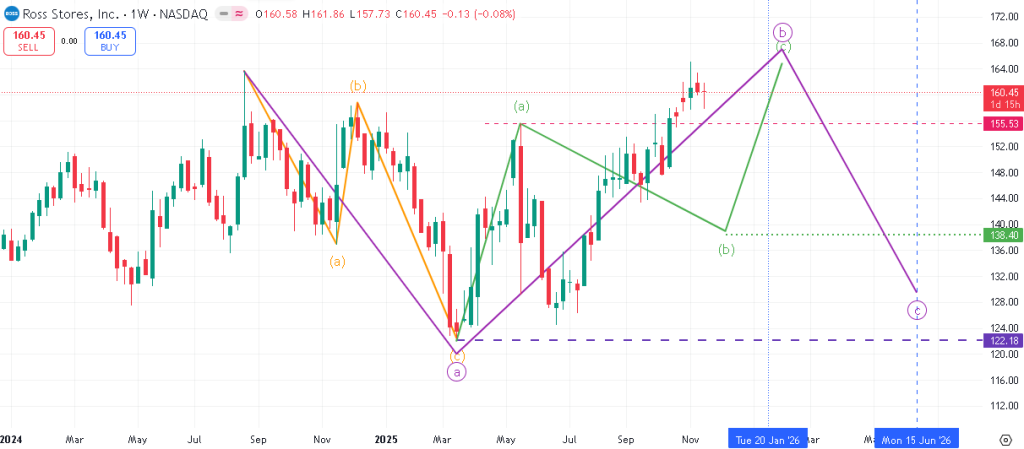
Current Cycle State: Sub-dividing Wave B (Purple) / Counter-Trend Rally
| Component | Visual Indicator | Analysis & Projection |
|---|---|---|
| Primary Degree | 🟣 Purple Labels | Higher-degree A-B-C correction. • Wave A: Sharp drop ($163 → $122.36) post-tariff shock. • Wave B: Ongoing recovery (current). • Wave C: Projected final leg down to ~$138 zone. |
| Intermediate Degree | 🟢 Green Labels | The lower bound holds the current “Three” pattern together. |
| Internal Waves | 🟡 Orange/Yellow | Micro-structure of Green Wave (a): tracks intra-day trend strength. |
| Time Projection | 🔵 Vertical Dotted | Estimated duration for completion of Wave (c) and Wave B/C based on historical cycle symmetry. |
| Support Floor | ➖ Thick Interrupted | The lower bound holds the current “Three” pattern together. |
🚨 Critical Pivot Level: A Weekly/Monthly close below $155.58 invalidates the current bullish momentum and confirms that Wave (b) in green (or the larger Wave C) has gained control.
🔮 What is your price target for Ross Stores (ROST) by Q2 2026?
Submit your forecast and see how you compare with the community!
Since peaking at an all-time high of $162.85 (November 12, 2025), ROST appears to be completing a complex corrective structure – a Three (similar to Running Flat or Expanded Flat in Wave B) that began after the initial post-tariff Wave A decline to $122.36 in April 2025.
The ongoing B-wave rally has retraced most of the prior drop and is showing signs of exhaustion near the recent highs. Today’s earnings release could act as a catalyst for the final Wave C downside leg, potentially targeting ~$138 by late spring 2026 if the bearish setup confirms.
Key Trading Signals
- Bearish confirmation: Close below $155.58 (invalidates the B-wave count).
- Risk: A strong earnings beat could push shares toward $ 165 or higher and invalidate the short-term corrective outlook.
Warning: A crossing below 155.58, although necessary, is not a definitive factor for total downside. The wave (b) in green seems sharp and doesn't have its pair, so the earnings could drive the price drop temporarily for the last upside leg to finish the higher degree wave: wave b in purple.
Conclusion on Ross Stores stock
Overall: While the Elliott Wave pattern suggests near-term downside risk, the broader fundamental story (value-seeking consumers, potential tariff tailwinds for off-price) leans constructive longer-term. Analyst targets imply limited urgent upside from here, making today a reasonable spot for caution.
Conservative/Long-Term Investors: The off-price model remains structurally strong, analyst support is solid, and tariffs may ultimately drive more traffic/bargains to Ross. Hold or add on weakness below $155 only if fundamentals deteriorate sharply.
Active Traders (Technical Focus): Consider taking partial/full profits into today’s report or initiating modest short positions, given the mature B-wave setup and earnings volatility risk. Target $138 (late spring 2026) with a stop above recent highs.