



Deutsche Telekom is one of the stocks that, along with other capital market companies, saw a revival after Donald Trump’s 90-day pause in the announcement of tariffs on April 2, 2025. In the article below, we’ll look into Deutsche Telekom’s fundamentals and technical aspects. We’ll analyze fundamental metrics from various sources and examine the stock’s price action using the Refined Elliott Wave Theory.
Deutsche Telekom Overview
Deutsche Telekom is a public company listed on the Frankfurt Stock Exchange (Frankfurter Wertpapierbörse or FWB) under ISIN: DE0005557508. It operates in the telecommunications sector and is headquartered in Bonn, Germany.
Deutsche Telekom provides telecommunication services through its two core companies, T-Mobile and T-Services. It offers its clients telephony equipment, fixed-line and mobile phones, and fiber and broadband services. Its clients span over 10 European countries and a growing segment in the USA.
Deutsche Telekom Fundamentals
Deutsche Telekom Recent Financial Results
In Q4 2024, Deutsche Telekom’s results exceeded estimates by $0.05 per share, with revenue reaching $3.39 billion. Annual revenue rose to $118,432 million, representing a 3.22% increase compared to fiscal year 2023. However, revenue has declined since 2020, primarily due to decreased demand since the 2020 plague.
The company’s net income decreased from $17,788 million in 2023 to $11,209 million in 2024, representing a significant reduction in profitability.

The following earnings report is scheduled for release on May 15, 2025.
Deutsche Telekom Valuation
As of the most recent close at €31.18, Deutsche Telekom trades at a price-to-earnings (P/E) ratio of 13.74.
This valuation is currently below its main competitors like AT&T Inc. (NYSE: T) – 16.44, and Orange S.A. (EPA: ORA) – 16.67, but remains above Vodafone Group Public Limited Company (LON: VOD) – 9.68 and Verizon Communications Inc. (NYSE: V) – 9.98.
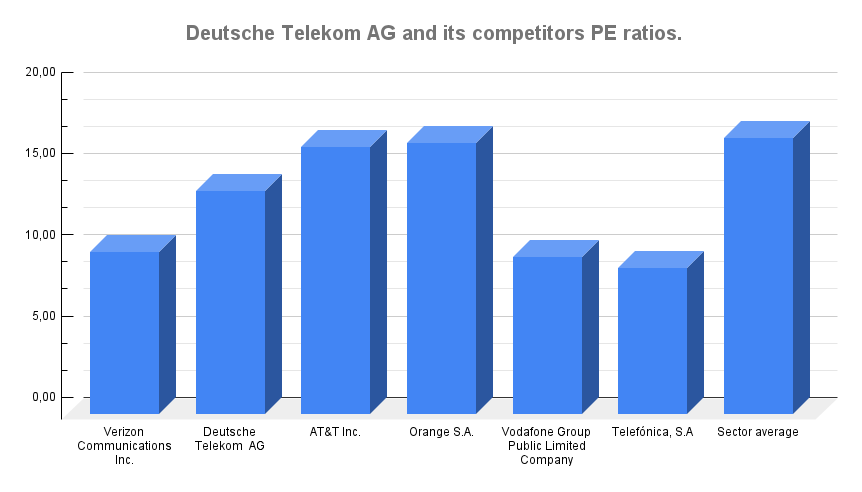
To further illustrate Deutsche Telekom’s market position, the following chart displays the company’s relative market capitalization compared to its top competitors:

Deutsche Telekom Cashflow
The company’s operating cash flow increased to $39,874 million in 2024, a 6.91% improvement over the previous year.
This positive cash flow development suggests underlying operational strength despite challenging market conditions and the decline in net income.
Deutsche Telekom perception and expectation
According to financial analysts, Deutsche Telekom’s target price is € 37.67.
Still, compared to its competitors, it has a Piotrovski F-Score of 9, which puts it ahead of AT&T Inc. (score 8), Orange S.A. (score 8) and Vodafone Group Public Limited Company (score 6).
Its factor analysis chart, composed of value metrics for dividend yield, analysts’ sentiment, fund sentiment, stability (volume), momentum, value, profitability, and growth, suggests a more circular and stable rating for Deutsche Telekom.
A similar 5-factor analysis from highly reputable financial metrics suggests a more cautious approach to investing in Deutsche Telekom. This caution is due to its unhealthy financials, especially debt and short-term debt obligations.
While this represents a potential upside from current levels, our technical analysis suggests a more complex short-term outlook.
Deutsche Telekom technicals
Current Price Action Analysis
The stock fluctuates from €32.9 and appears to have exhausted much of its upside momentum in the near term. However, according to our metrics, the price will increase again. At this point, it would enter the overbought territory.
Potential Elliott Wave Scenarios
Two primary Elliott Wave scenarios are possible from the current price level:
- Running Flat Pattern: In this scenario, the price would not need to decline from current levels before resuming the uptrend. This scenario will confirm if the price action forms an a-b-c structure (in black wave notation) while not invalidating the €30.23 level. (Fig. 3)
- Expanded Flat Pattern: Alternatively, the price could fall slightly below €30.23. The time-based characteristics of the preceding C-wave (in black) development suggest a limited probability of significant further decline under this scenario. (Fig 4.)
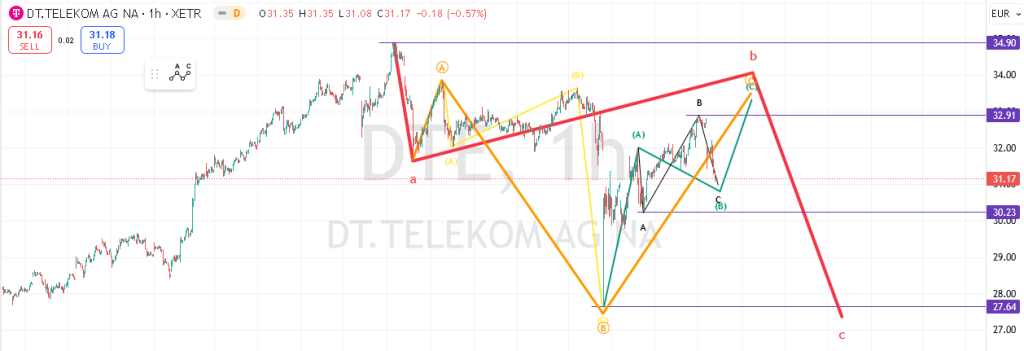
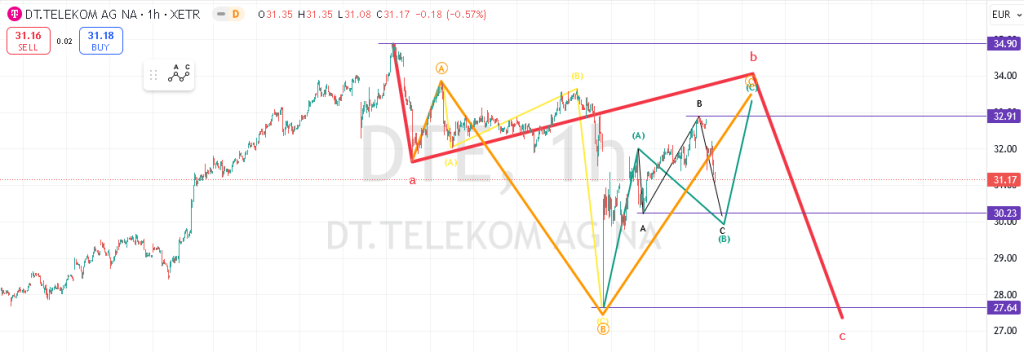
Based on our wave analysis, a strong upside move from current levels, assuming proper wave structure confirmation, is approximately 80% likely.
Risk Factors and Warning Signs
Caution: If the price does not advance quickly, it may indicate the completion of what we’ve labeled the c-wave (teal) and the b-wave (red). The entire structure would require careful monitoring for potential pattern failure in this case.
In rare cases, the sub-waves labeled a-b (orange) in previous scenarios may not necessarily be components of the red b-wave. If the price stalls after reaching Friday’s April 25 high or does not reverse in one day, the new drawing of the structure will be as follows:

The sharpness of any price decline would indicate the ultimate confirmation of our primary scenarios. A slow, time-consuming structure would invalidate this scenario concerning the intermediate red b-wave formation.
Short-Term Outlook Confirmation Signals
Bullish Confirmation: Price action maintaining support above €30.73 while establishing higher lows would support the bullish case.
Bearish Confirmation: After potentially climbing above €32.81, a decisive move below €30.73 would confirm a possible decline toward the year’s low of €27.64.
Conclusion
Deutsche Telekom presents an interesting technical setup at current levels. Our analysis suggests two primary scenarios:
- If the price drops sharply from current levels without completing the Zig-Zag pattern’s final leg (wave C in teal), a potential accumulation strategy could be considered as the price approaches or breaks below the €27.64 level.
- Completion of wave C (orange) of the Running Flat at €32.91 would provide a clearer signal, potentially setting up a launching pad for a subsequent price decline.
🌱 Support independent research and analysis on market opportunities!
💛 Morraevo is an independent, self-funded project. If you value this work, consider supporting it here.
If you liked this you might also like Breaking down Banca Transilvania (TLV Technical Overview)

⚠️ Disclaimer
This article isn’t trading advice, and any financial loss associated with it is solely your responsibility.
However, a more cautious investment approach can generate stability and profit in the long run.
Refined Elliott Wave patterns are complex to identify, and there is always room for error. I don’t recommend using them, especially if you are a beginner in investing. Always seek professional financial advice when investing. Thank you!
